UND Weather Wall
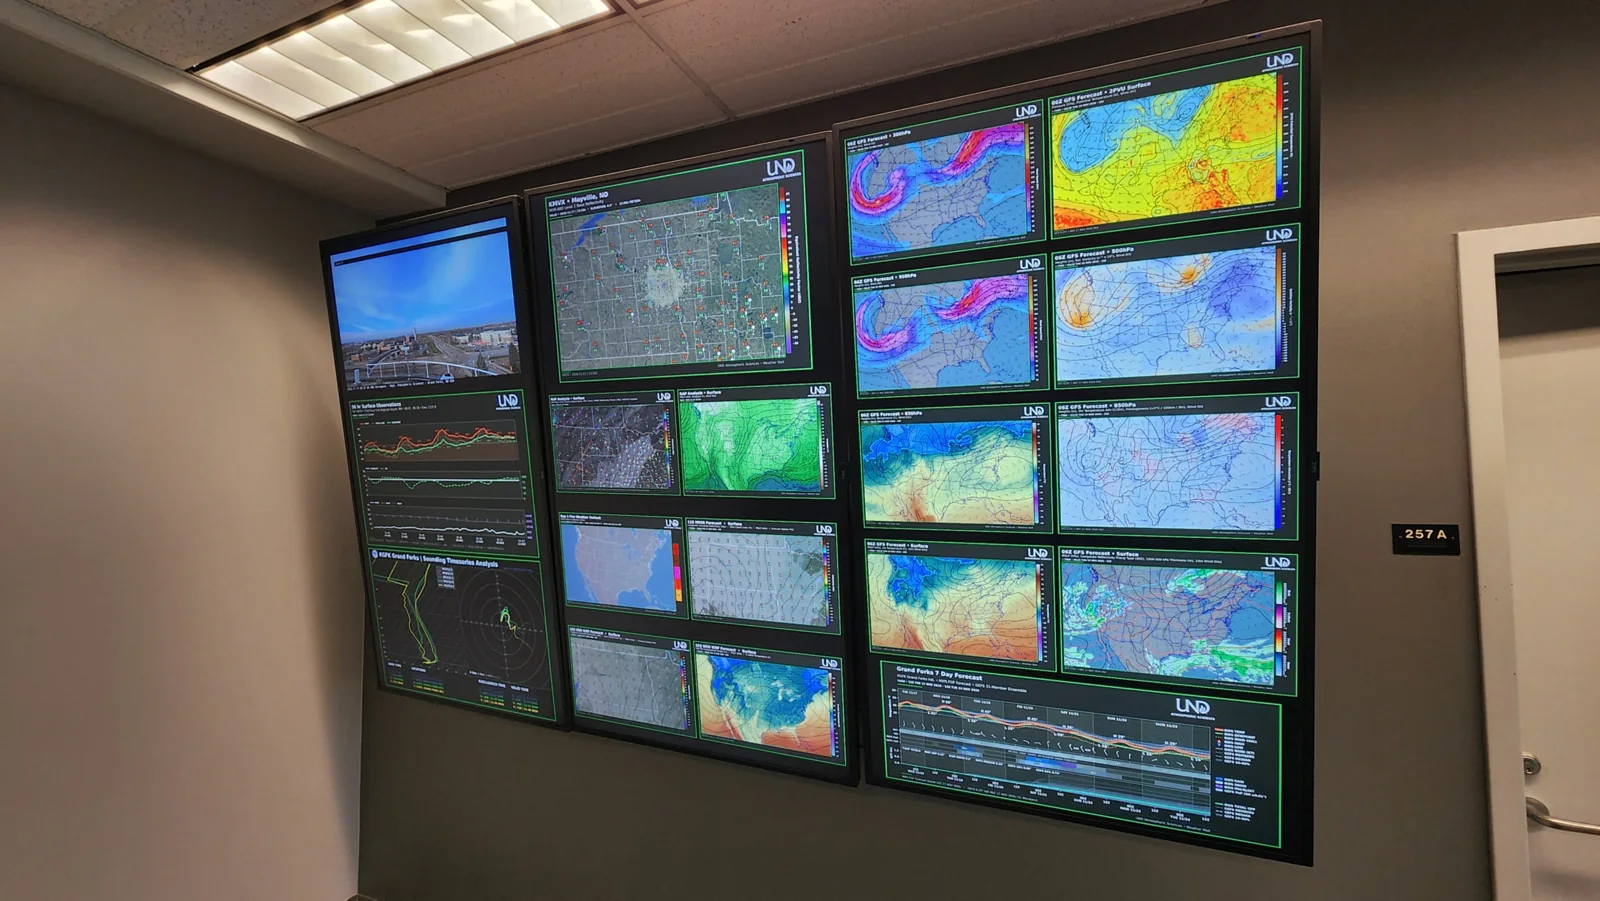
The live weather analysis and forecast "map wall" in the Leon F. Osborne Weather Center at the University of North Dakota.
The Leon F. Osborne Weather Center Map Wall
The new Leon F. Osborne Weather Center "Weather Map Wall" marks a new chapter in the UND Department of Atmospheric Sciences' tradition of displaying local, regional, and national weather information. In past decades at the department's former Severe Weather Analysis Center, faculty and students analyzed and hung paper maps on the wall to monitor weather conditions. Today, that tradition continues in a modern form through a real-time display of automated maps and charts featuring satellite and radar imagery, surface and upper-air observations, and forecast products spanning North Dakota, the Northern Plains, and the nation.
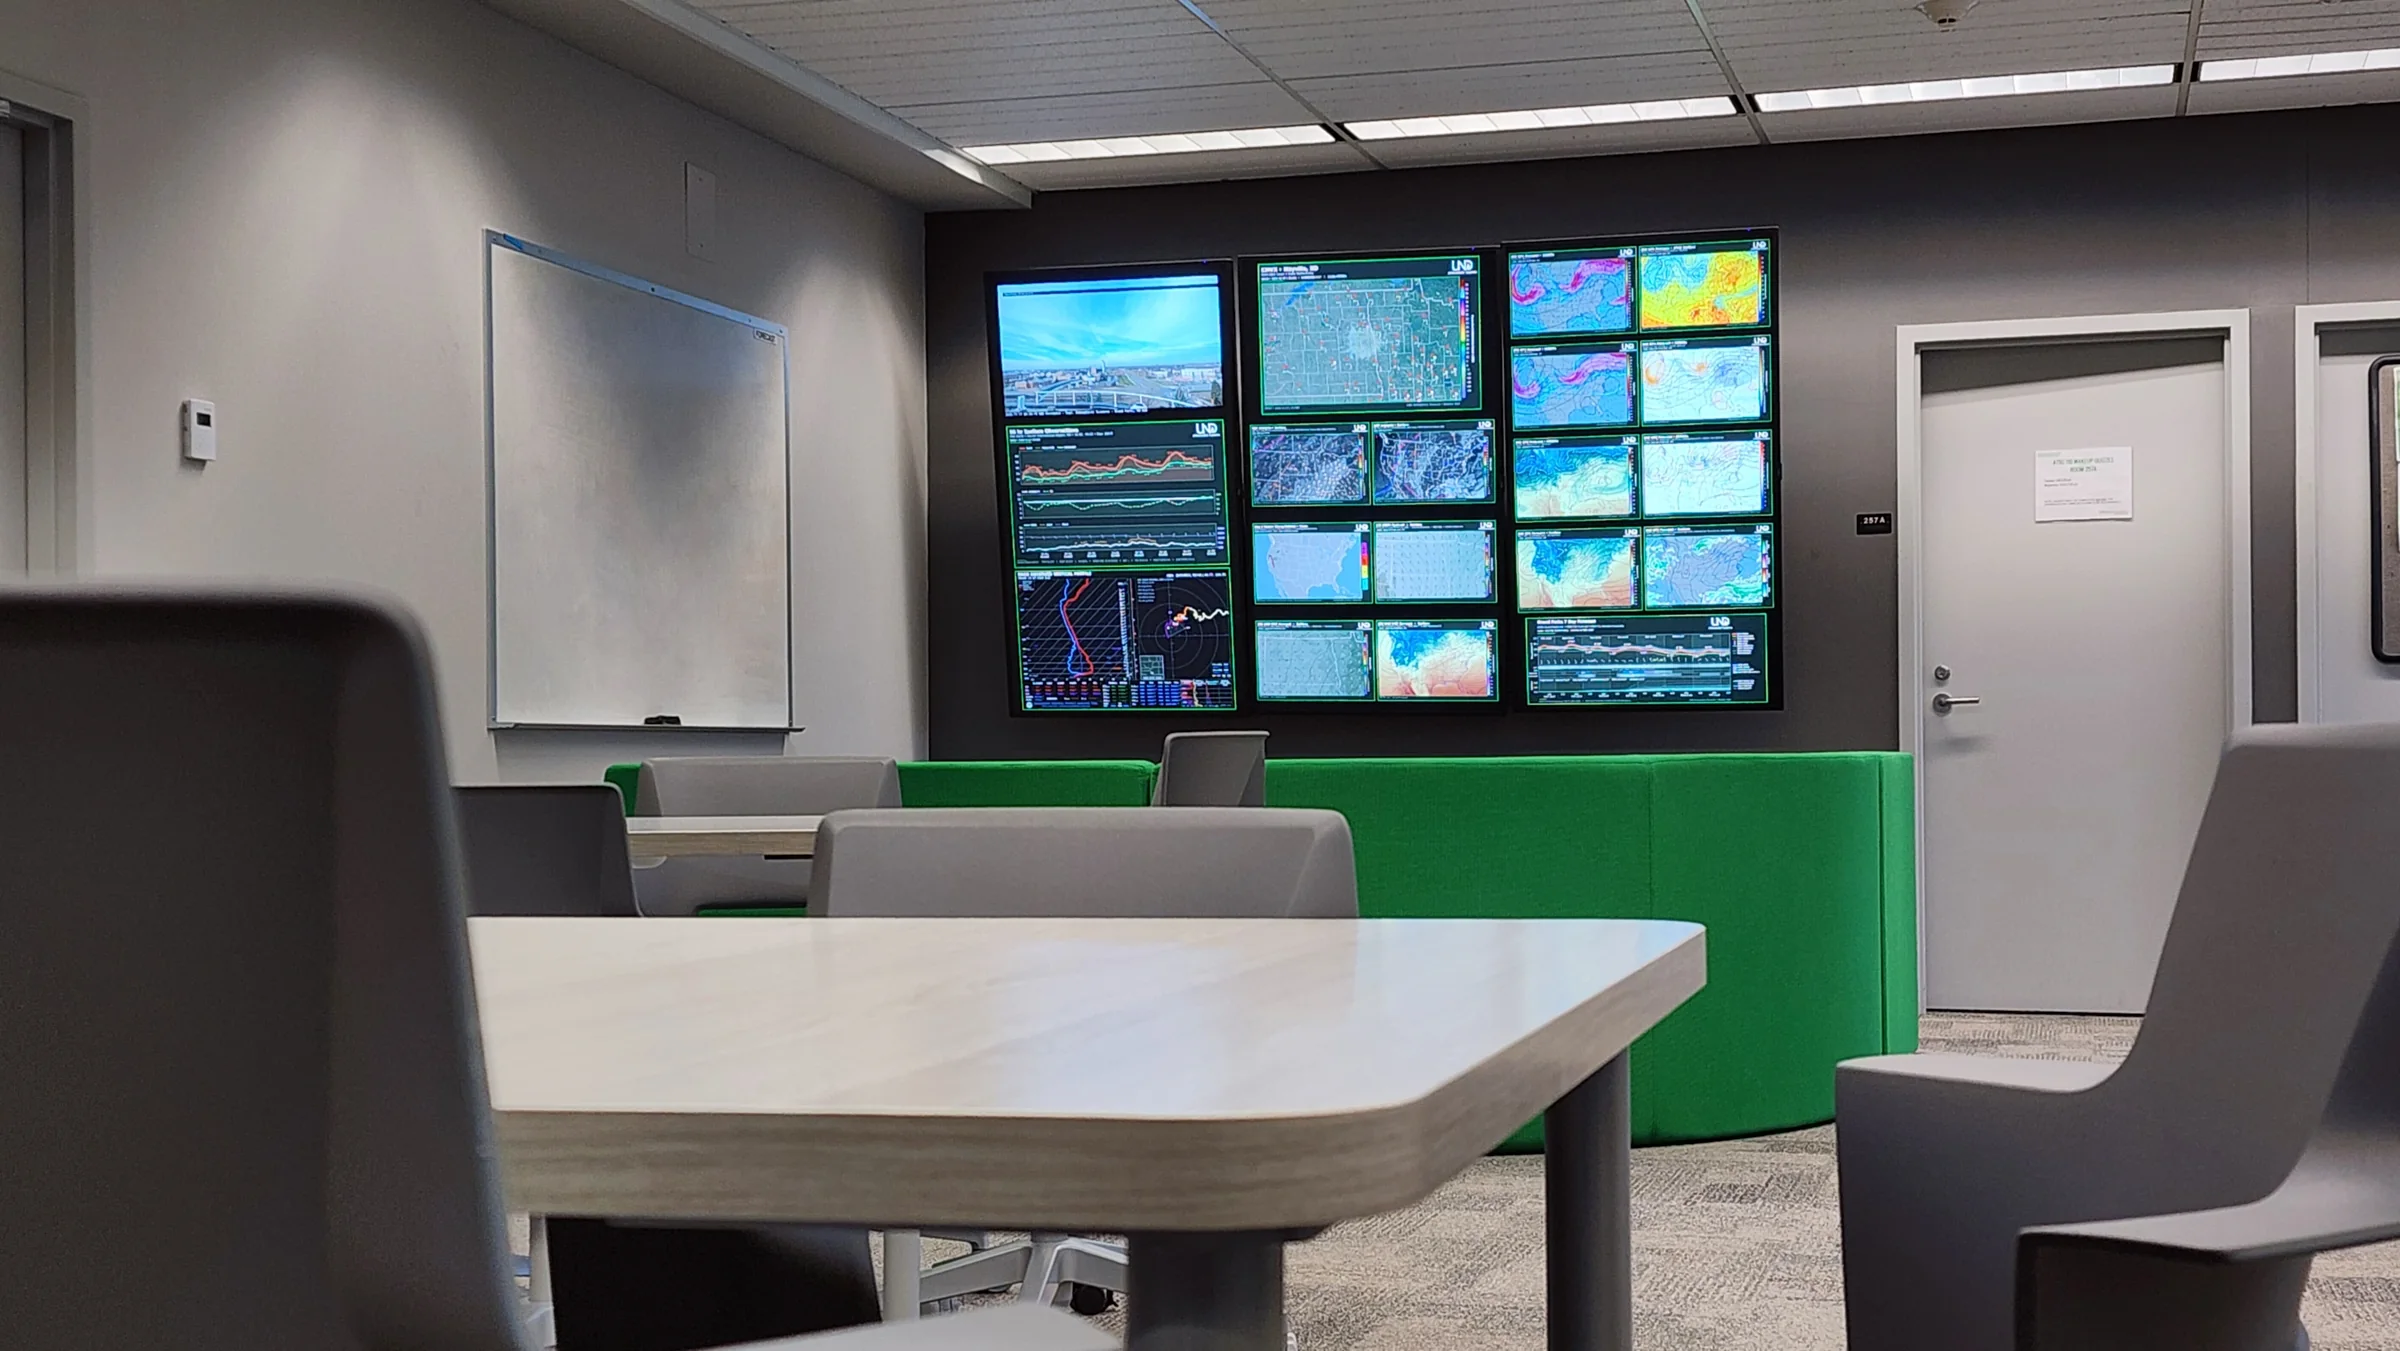
Why build it
More than just a collection of weather charts, the map wall provides real-time situational awareness during developing weather events, highlights the department's ongoing research and forecasting capabilities, and offers students a hands-on educational resource for observing and monitoring the atmosphere. Its accompanying online format extends that experience beyond campus, providing an accessible resource for meteorologists, weather enthusiasts, and prospective students interested in studying atmospheric sciences at UND.
Behind the Screens: How it works
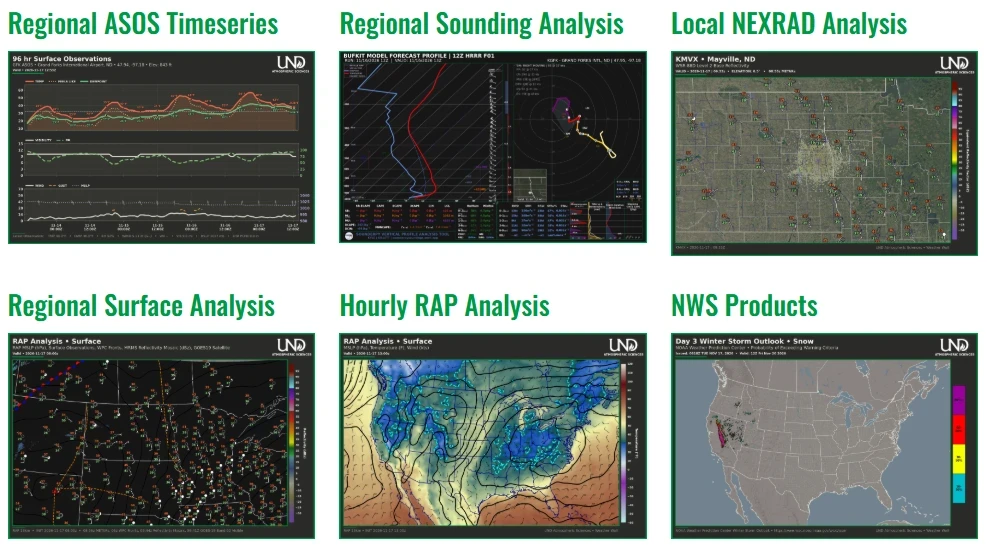
Each map and chart is internally processed by the UND Department of Atmospheric Sciences, powered by custom automated software infrastructure, which retrieves, analyzes, and visualizes meteorological data from a variety of NOAA and internal sources. The back-end infrastructure is built entirely on Python and runs on an internal 10GB-RAM server. Fetcher and builder scripts are automated with scheduled system jobs that generate figures and send them via curl to the physical and virtual mapwalls.
| Minute | How often | Products |
|---|---|---|
| :00, :15, :30, :45 | Every 15 minutes | Local NEXRAD analysis, regional RAP surface analysis |
| :04 | at 03, 09, 15, 21 UTC | GFS forecasts, NWS FGF & GEFS 7-day forecast meteogram |
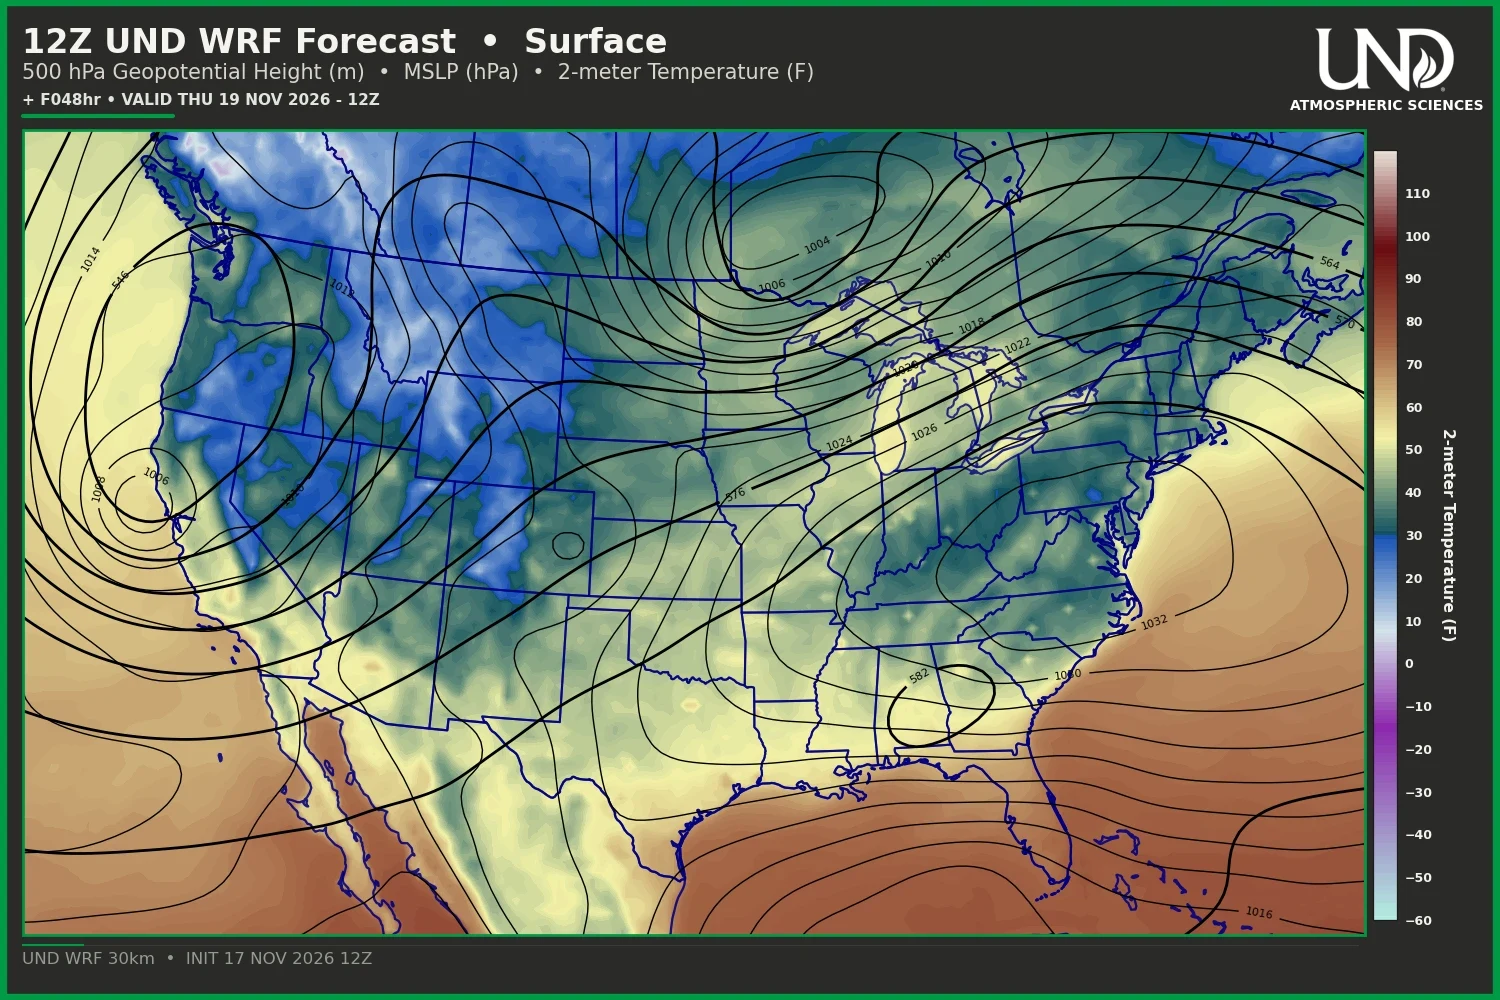
| :00 | Every 6hrs | 30km UND-WRF Forecast Model |
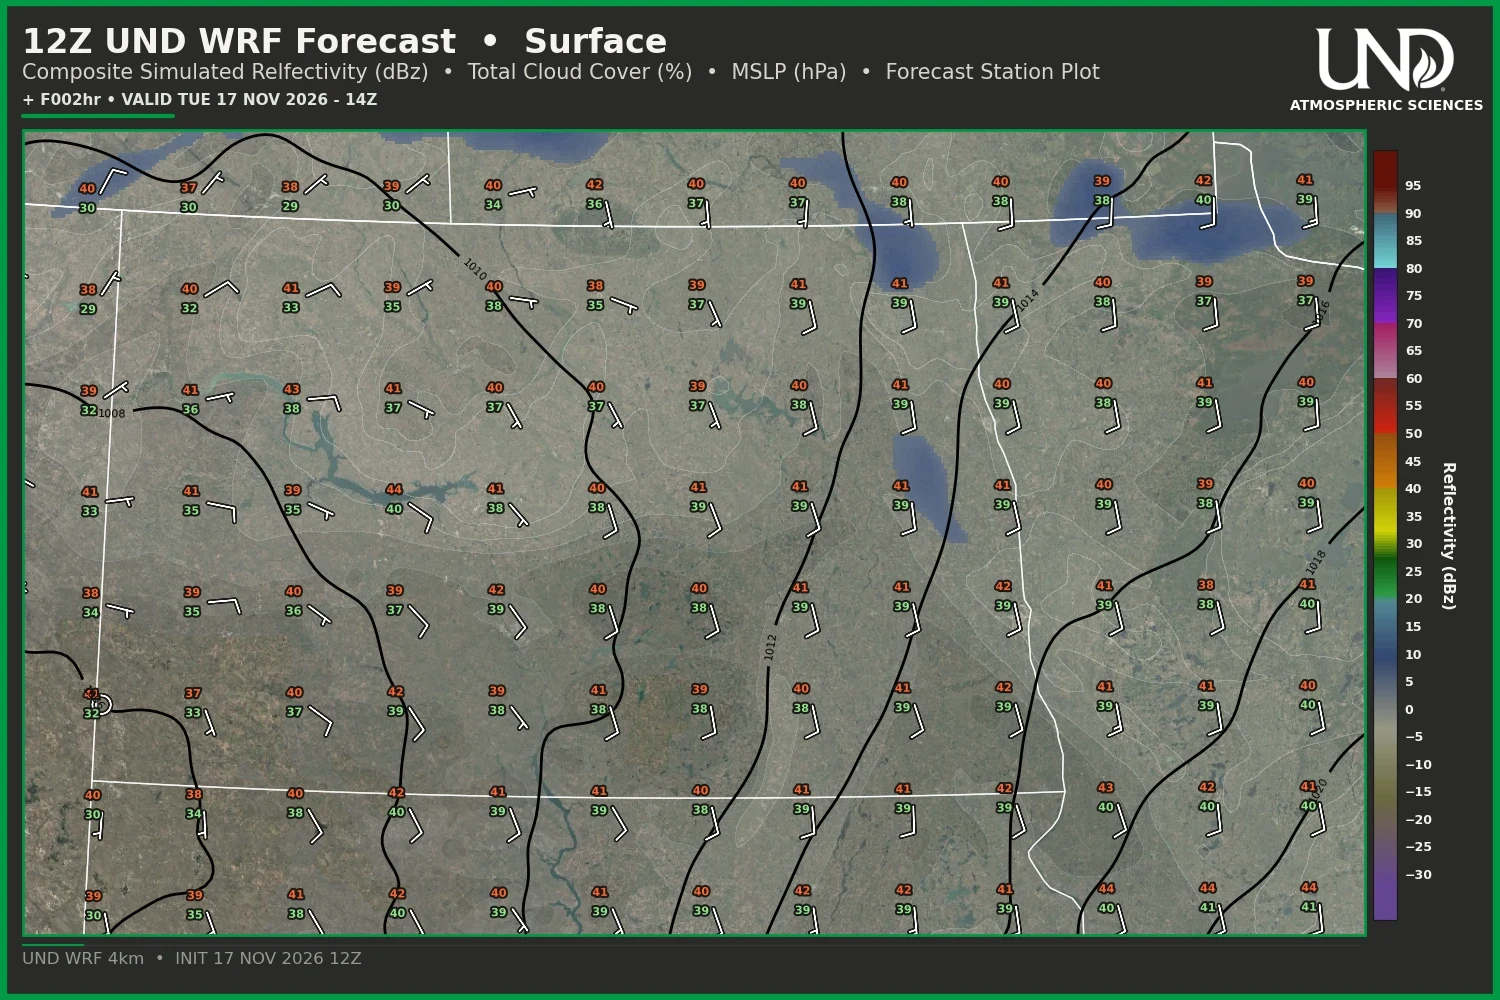
| :00 | Every 3hrs | 4km UND-WRF Forecast Model |
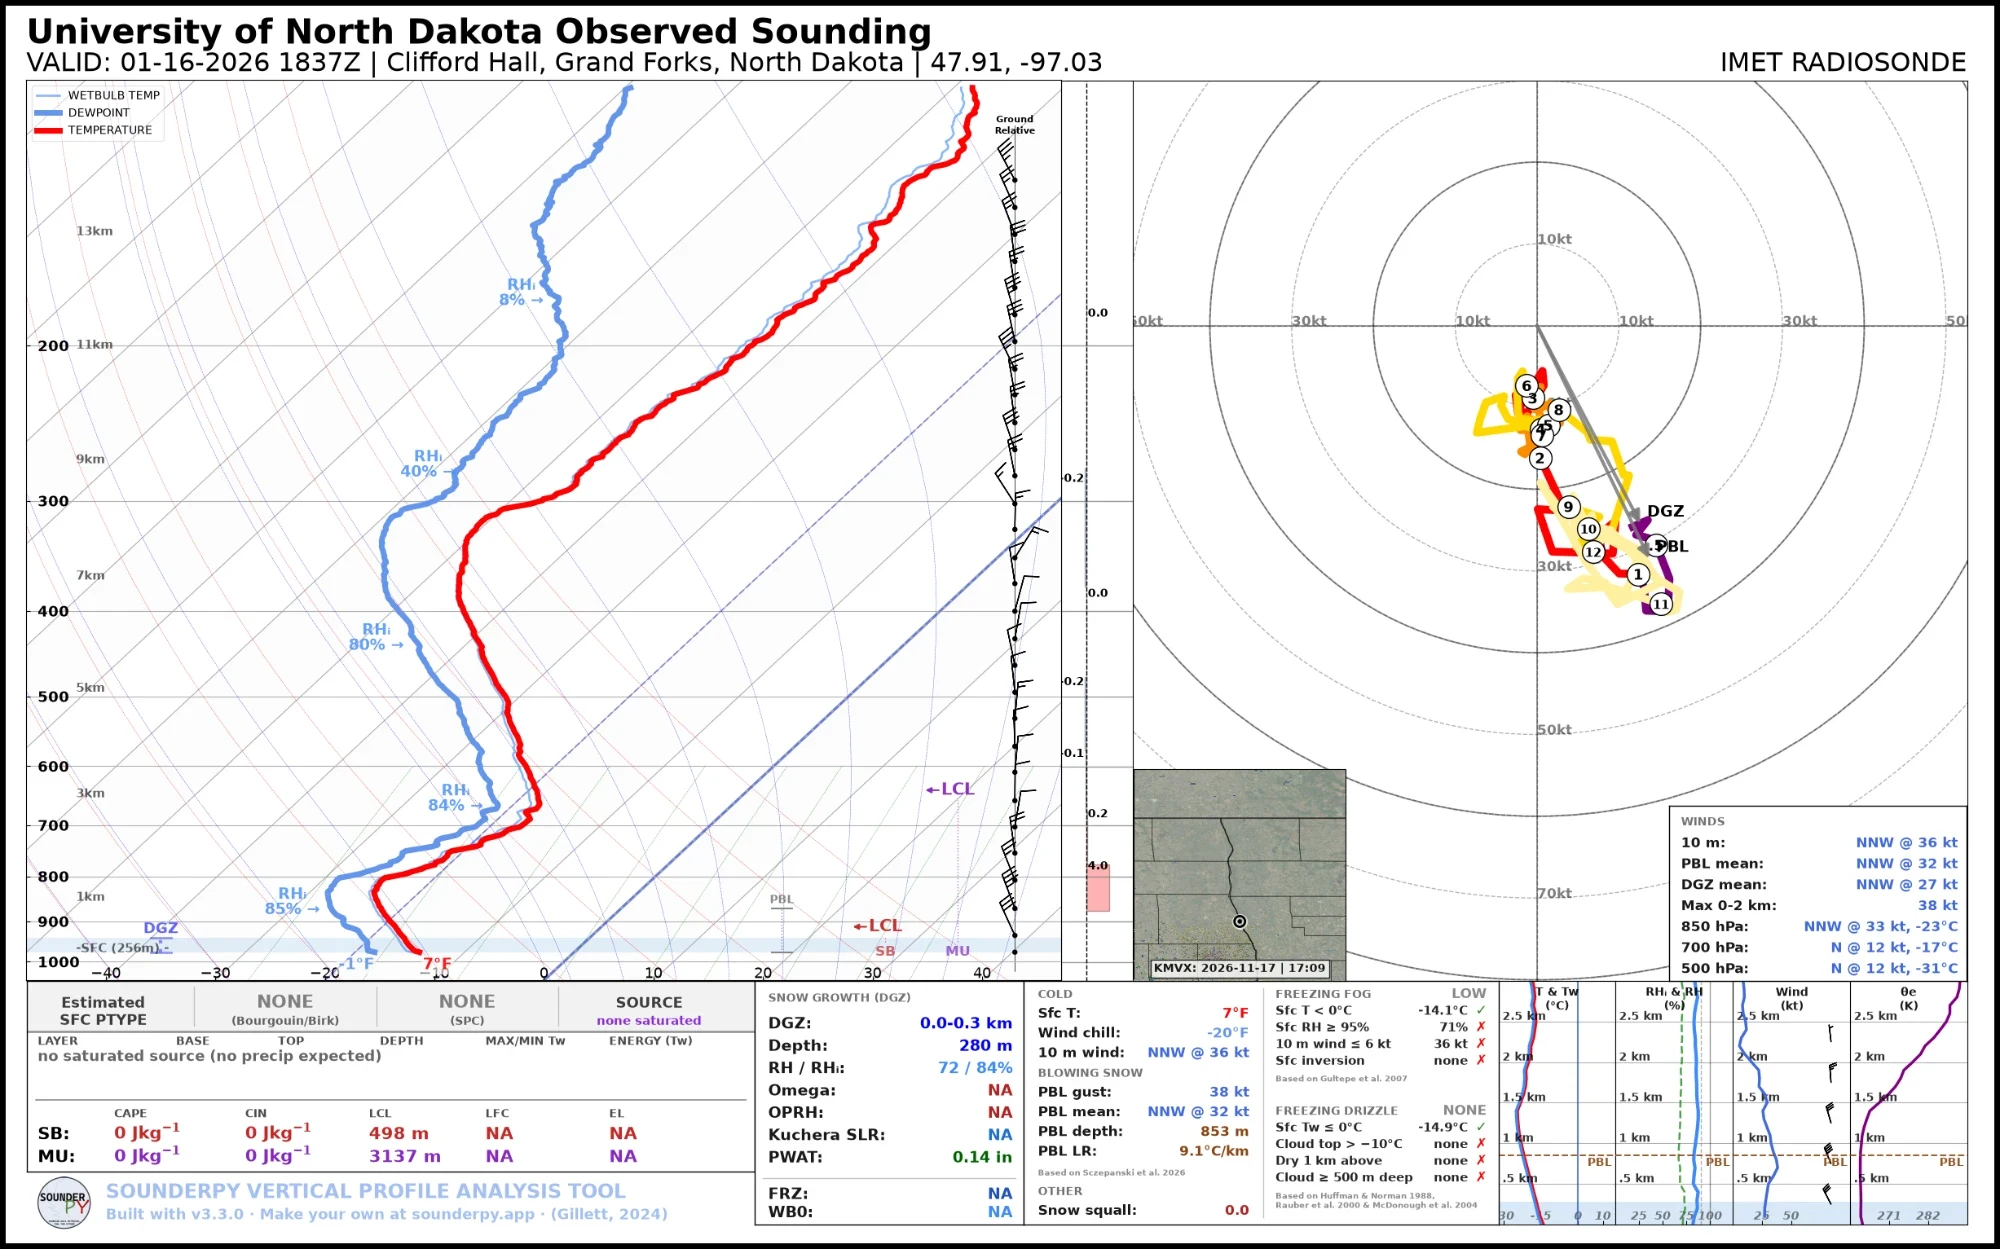
| :20 | at 01, 13, 19 UTC | Regional observed soundings |
| :34 | Every hour | CONUS RAP analysis, HRRR forecasts, NOAA outlooks |
| :50 | Every hour | Regional ASOS meteograms, BUFKIT analysis soundings |
Products built at UND
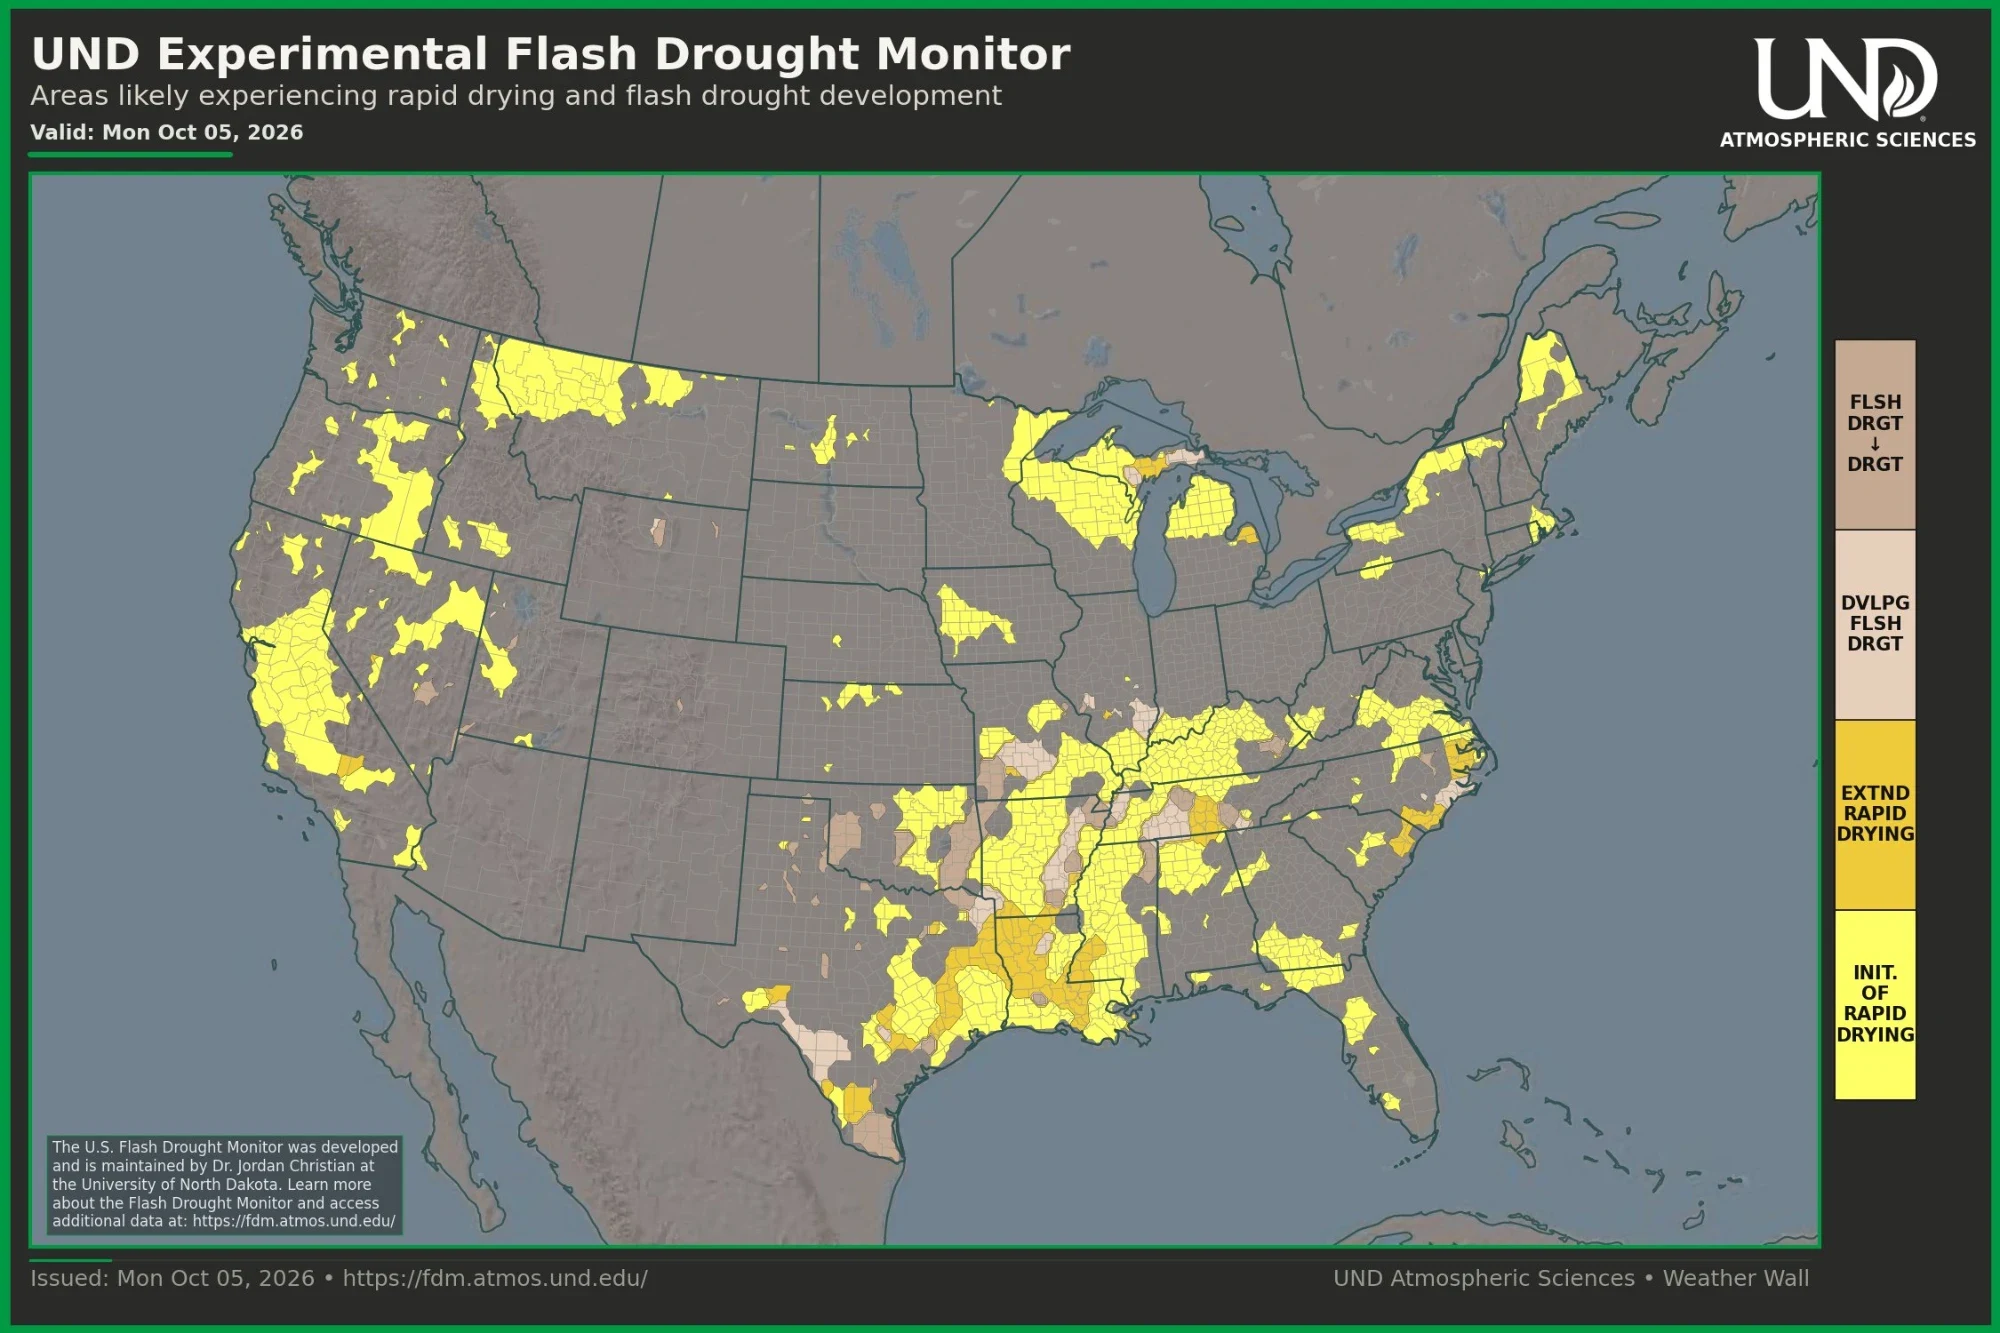
While much of the raw data comes from the National Oceanic and Atmospheric Administration (NOAA), the map wall also displays research and forecasting products developed right here at UND. These include Dr. Jordan Christian's US Flash Drought Monitor and the UND Weather Research and Forecasting Model (UND-WRF), a regional weather prediction model focused on North Dakota and the Red River Valley. During significant weather events, the Weather Wall also features weather balloon observations collected on campus by Dr. Aaron Kennedy's research group, processed with SounderPy.
In the news
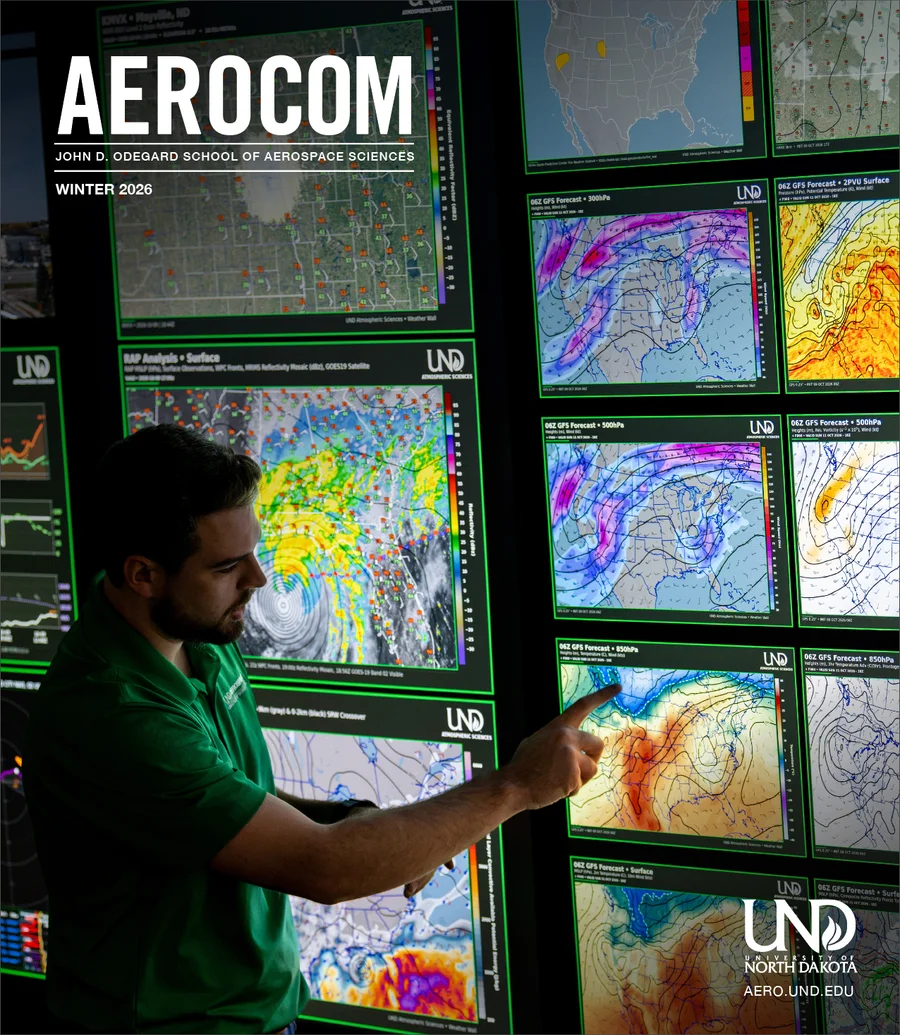
On the cover of AEROCOM
The weather wall is on the cover of the Winter 2027 issue of AEROCOM, the magazine of UND's John D. Odegard School of Aerospace Sciences.